

Fitbit’s Estimated Oxygen Variation Graph Now Available To All
Fitbit’s new Estimated Oxygen Variation graph is available now to all Charge 3, Ionic, Versa, Versa Lite, and Versa 2 users. This new feature, which we originally announced at our September launch event and began rolling out to some users in January, utilizes the red and infrared sensors on the back of the device to estimate the variability in your blood oxygen saturation level.
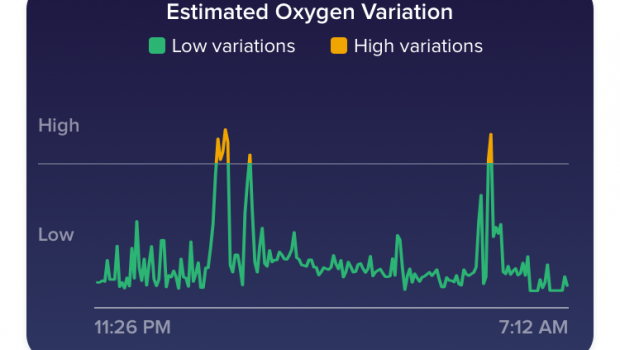
The graph, which users can see in the Fitbit app under the Sleep tile, approximates the changes in your blood oxygen saturation while you sleep. Blood oxygen saturation measures thepercent of your blood that’s saturated with oxygen. Typically, it’s at 95-100%, meaning the blood is carrying as much oxygen as it can. If you stop breathing or have other lung issues, the saturation level can fall since less oxygen enters the body. In general, variations should be low and seeing frequent, big variations could be a sign that you may be experiencing breathing disturbances during sleep.
The graph is another example of Fitbit’s commitment to providing more useful data to its users, but it is not intended for medical purposes. You should always consult your health care professional about any questions or health issues you may have.
About the Author
Adrian Gunning Adrian lives in Melbourne Australia and has a huge passion for gaming, technology and pop culture. He recently finished his a Bachelor of Journalism and is currently focusing on games journalism. When not writing and playing video games, Adrian can be found in Comics 'R' Us debating the pros of the DC Universe and cons of the Marvel Universe.
Related Posts

Samsung Teases New Foldables →

Reolink announces two weeks of Prime Day deals, with up to 46% off between June 30 – July 15 →

Logitech G Announces Partnership with Call of Duty: Modern Warfare 4 →